 Daily Race B
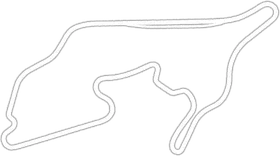
Garry Jarman posted this lap in the Lap Analysis thread on the Traces forum: the 1:48.056, lap 2 of the session. Here it is against the reference for Daily Race B, Week 45/2026, VQS_TAK's 1:46.864 in the same car, the yellow reference row in Traces, corner by corner.
A note on the data first. Garry shared the replay, and we downloaded it and recorded it, with the video. That turned out to matter. The session Garry uploaded is missing telemetry packets in places, so its clock runs 0.339 s short of the lap time, and the gaps in some corners would come out wrong. The recording of the replay is complete: it runs 108.033 s against the official 1:48.056, a difference as small as the reference recording's (106.833 s against 1:46.864). So every number below comes from that recording of Garry's lap.
Both laps are recorded from replays, Garry's and the reference. A replay's brake trace runs late, so both brake points are taken from where the brake lights come on, the way Traces does, and there's no comparison of how quickly the brake builds or when it comes off, because a replay can't show that reliably. The tyres aren't in either file, so it isn't known whether both cars were on the same ones. Every other number comes from Traces: the Coach, or the telemetry of the two laps measured at the same point on the track. Distances are metres from the start line along the reference's lap, and the corners are numbered by where the reference slows down, turn 1 to turn 9.
The summary
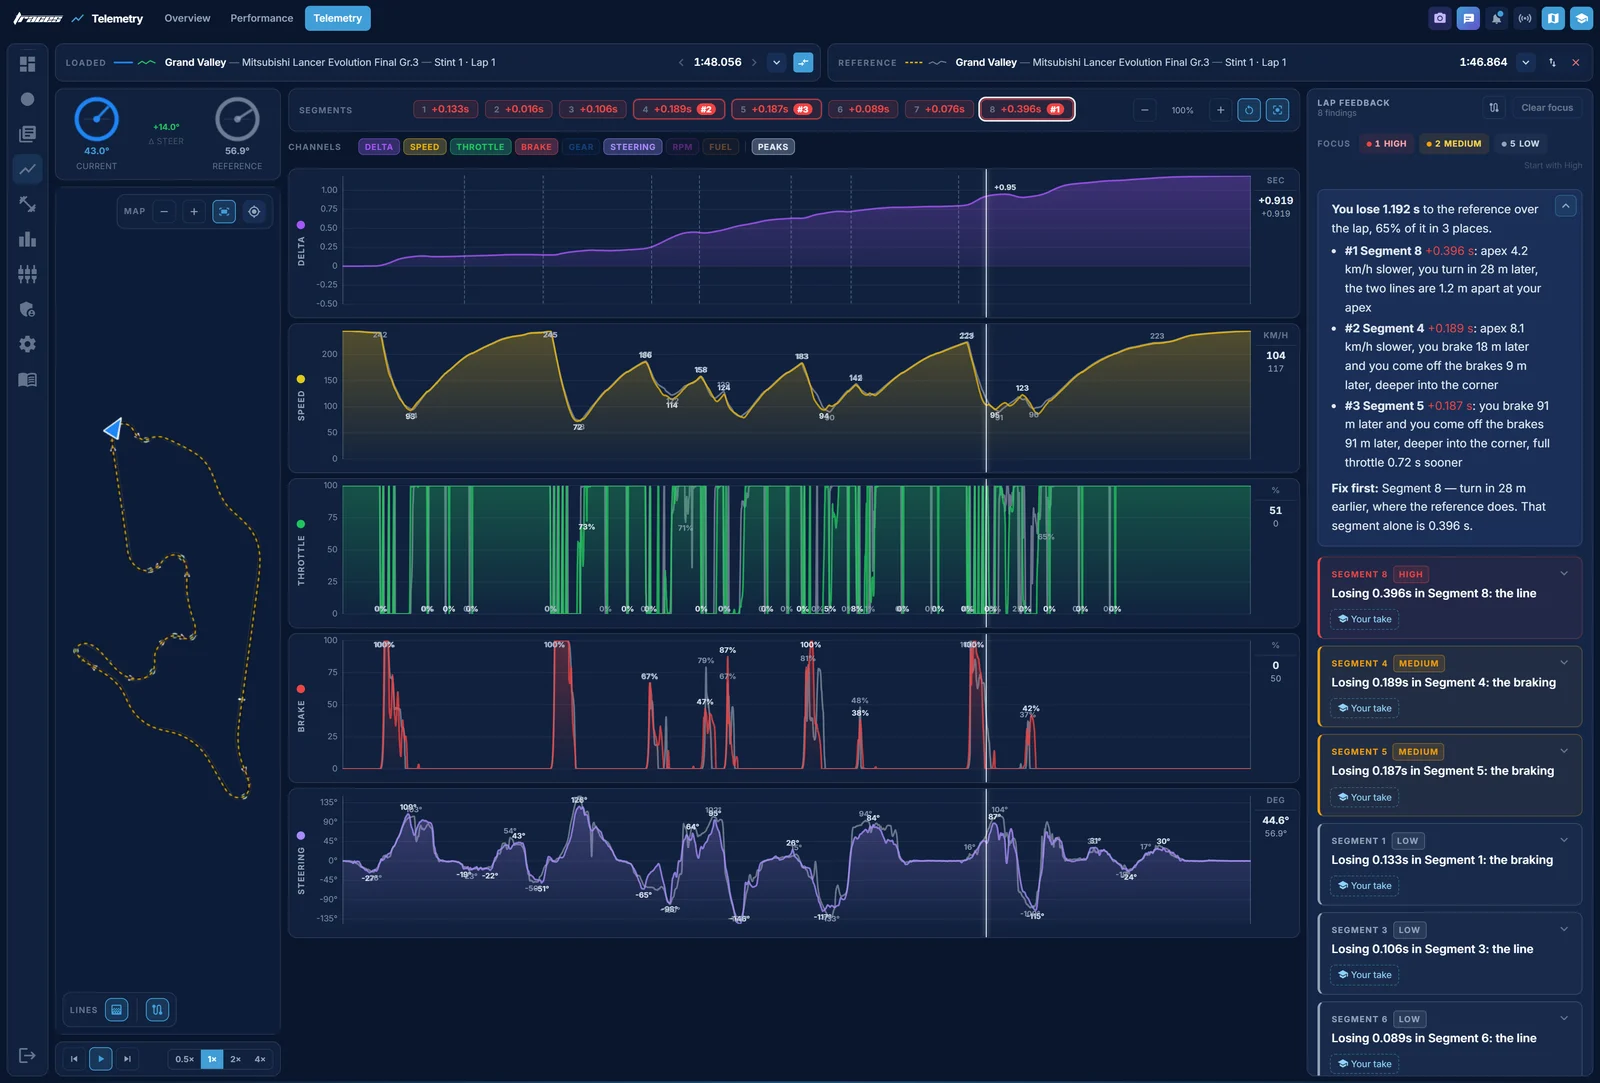
Garry loses 1.192 s over the lap. The Coach puts 65% of it in three places:
- Segment 8, +0.396 s: apex 4.2 km/h slower, the driver turns in 28 m later, the two lines are 1.2 m apart at the driver's apex.
- Segment 4, +0.189 s: apex 8.1 km/h slower, the driver brakes 18 m later and comes off the brakes 9 m later, deeper into the corner.
- Segment 5, +0.187 s: the driver brakes 91 m later and comes off the brakes 91 m later, deeper into the corner, full throttle 0.72 s sooner.
Fix first: Segment 8, turn in 28 m earlier, where the reference does. That segment alone is 0.396 s.
The Coach's brake measures read the brake trace itself, which runs late on a replay lap, so for the brake points use the numbers corner by corner below, taken from the brake lights. The places are right, though. Going corner by corner, the three most expensive ones hold 0.700 s, and they are the Coach's three segments: the stop for turns 8 and 9 (0.299 s, and the slower exit costs another 0.091 s on the straight to the line), turn 3 (0.227 s), and turns 4 and 5 (0.174 s). From turn 6 to the line it's 0.552 s against this reference.
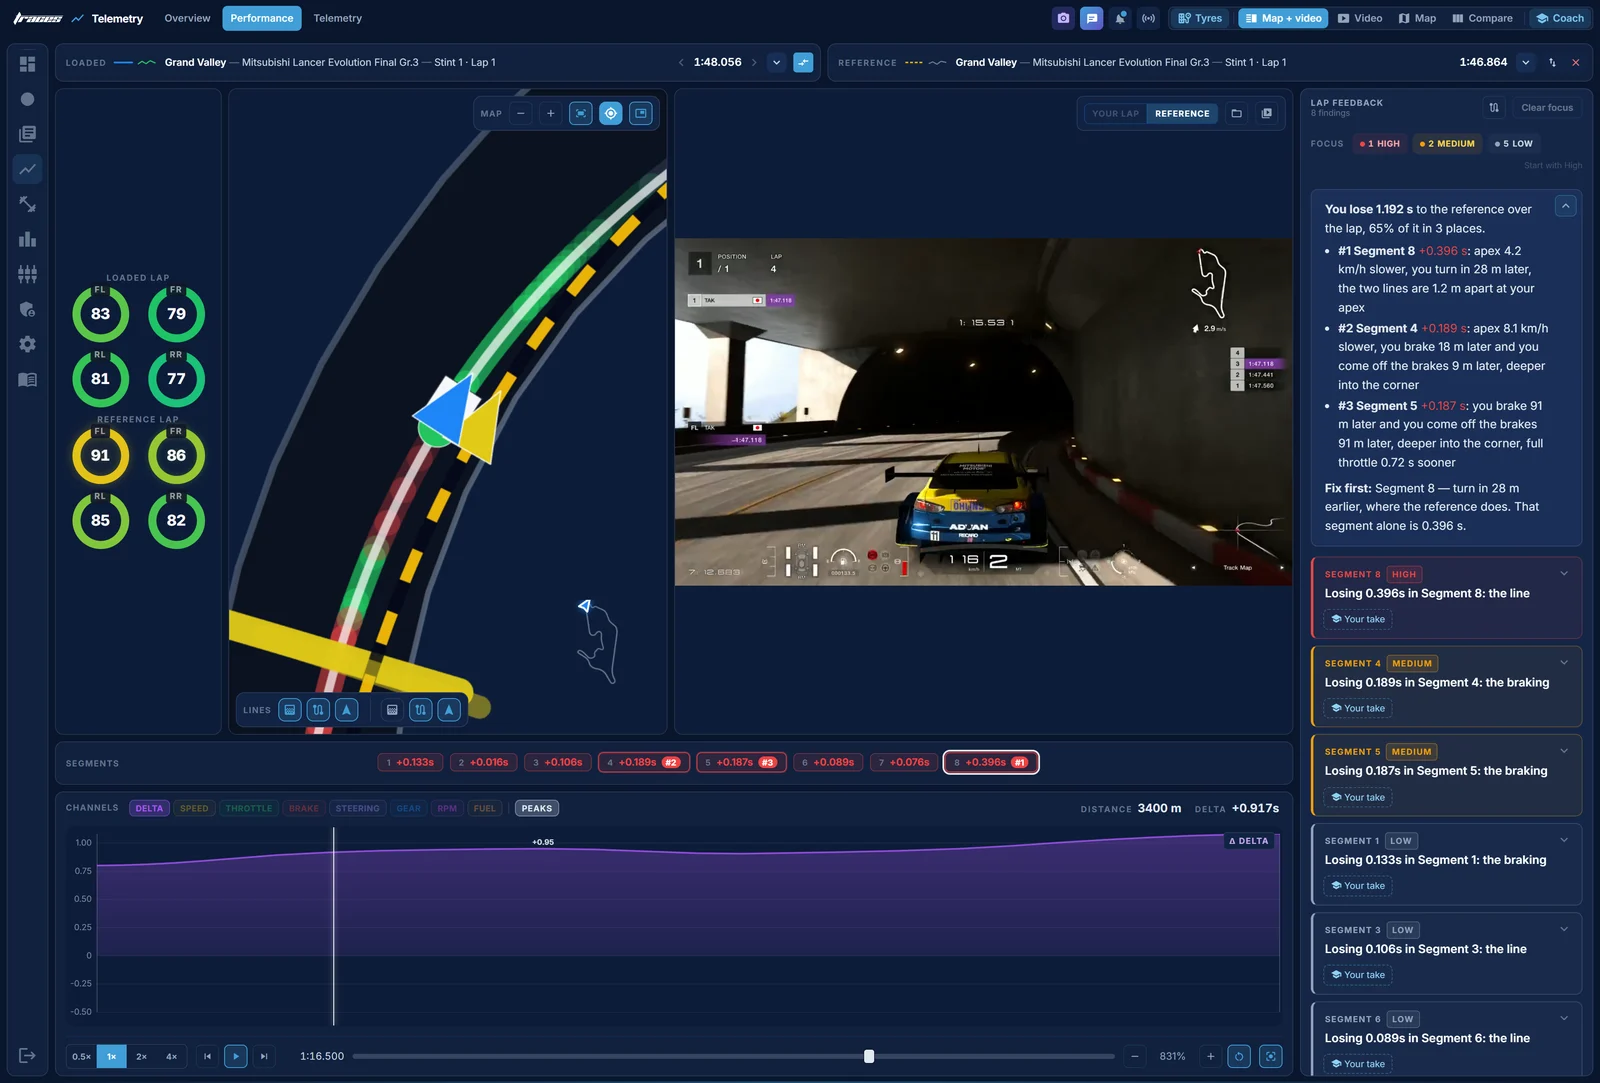
The one thing to fix first, the same as the Coach: Segment 8, the last stop. Garry brakes 9 m before the reference, and at 3,392 m is at 109.4 km/h where the reference is at 127.1. Garry's slowest point in turn 8 comes 14 m early, and in turn 9 Garry arrives faster, brakes deeper and turns in later: the slowest point is 86.4 km/h at 3,582 m against 96.2 km/h at 3,568 m. Less brake into turn 8, and an earlier turn-in to turn 9, where the reference turns in.
The habit behind most of it
Before going corner by corner, it helps to see the pattern. Garry's brake points are right: the braking starts within 10 m of the reference at every stop. What's different is how much the car slows in the first part of the stop. At the same metre, with both cars still braking, Garry's is already 5.4 to 17.7 km/h slower:
| Corner | Garry's brake point | Reference's | At | Garry's speed | Reference's |
|---|---|---|---|---|---|
| Turn 1 | 297 m | 300 m | 351 m | 176.1 km/h | 183.5 km/h |
| Turn 2 | 1,343 m | 1,345 m | 1,442 m | 109.9 km/h | 115.3 km/h |
| Turn 3 | 1,775 m | 1,777 m | 1,856 m | 128.9 km/h | 139.0 km/h |
| Turn 6 | 2,453 m | 2,449 m | 2,520 m | 111.3 km/h | 128.1 km/h |
| Turn 8 | 3,296 m | 3,305 m | 3,392 m | 109.4 km/h | 127.1 km/h |
So Garry's slowest point comes early, often before the reference's apex, and Garry is back on the throttle first. That wins some of it back: 0.035 s out of turn 1, 0.106 s after turn 6 and 0.142 s through turn 8. But it never wins back all of what the early slowdown costs. The reference brakes at the same point, keeps more speed through the middle of the stop, and lets the car roll to a later apex.
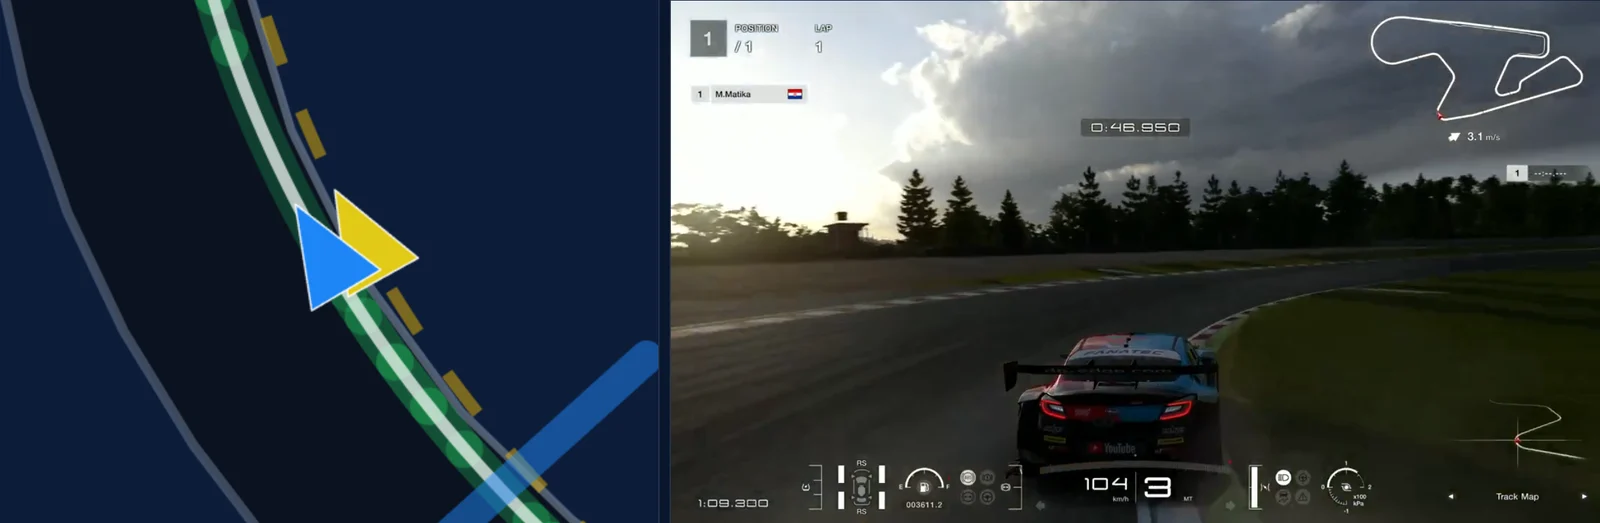
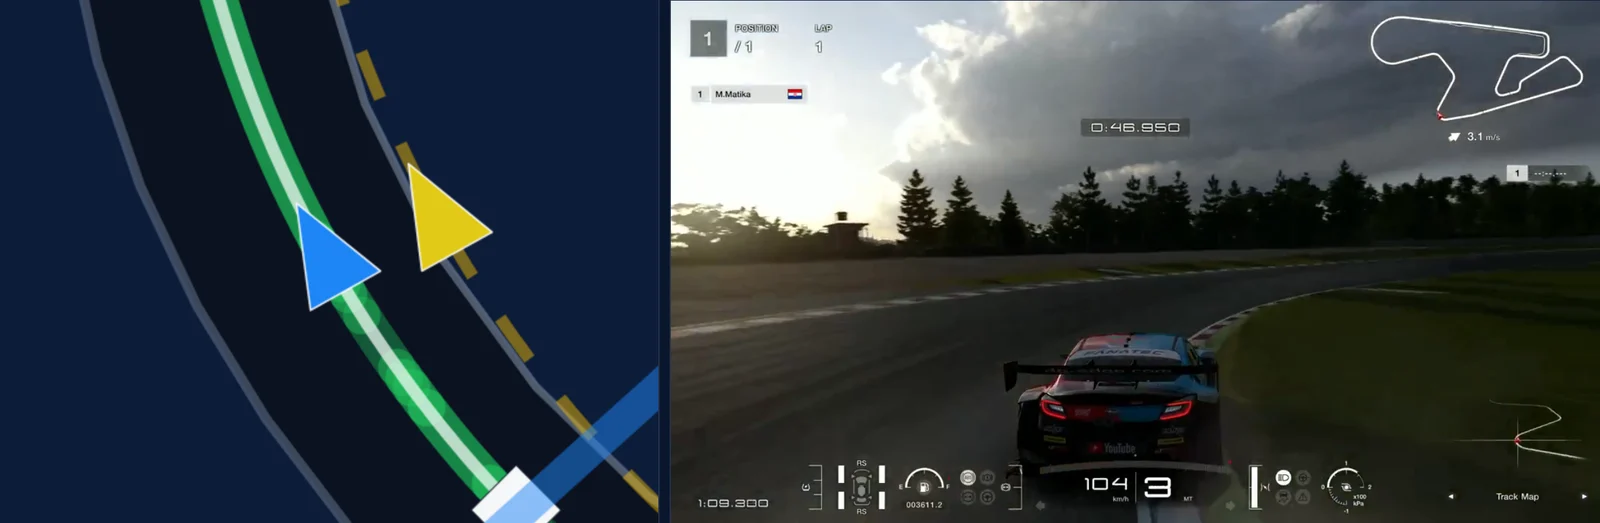
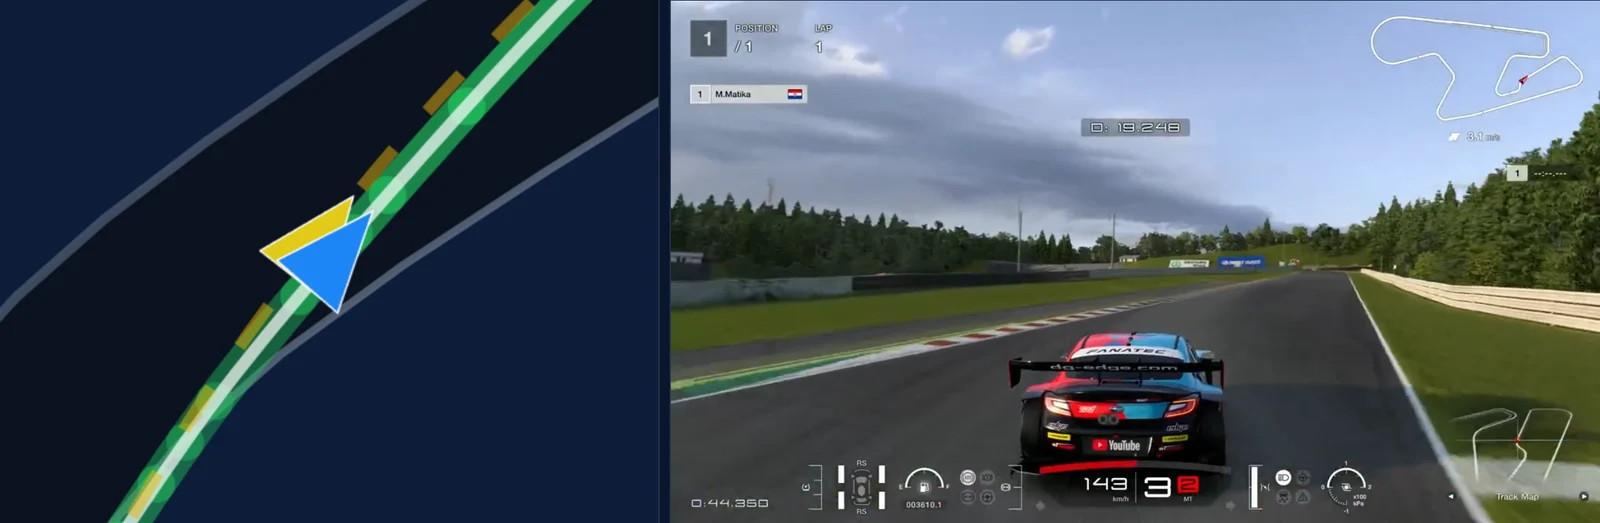
Each corner below has three pictures. The first is the Performance page with the map zoomed in on the corner and the reference's video at the same metre. The second puts Garry's replay and the reference's side by side at the same point on the track. The third is the Telemetry page zoomed to the corner. The short spikes in the throttle traces during braking are the blips on the downshifts, on both laps.
Turn 1: the right-hander at the end of the straight 0.124 s
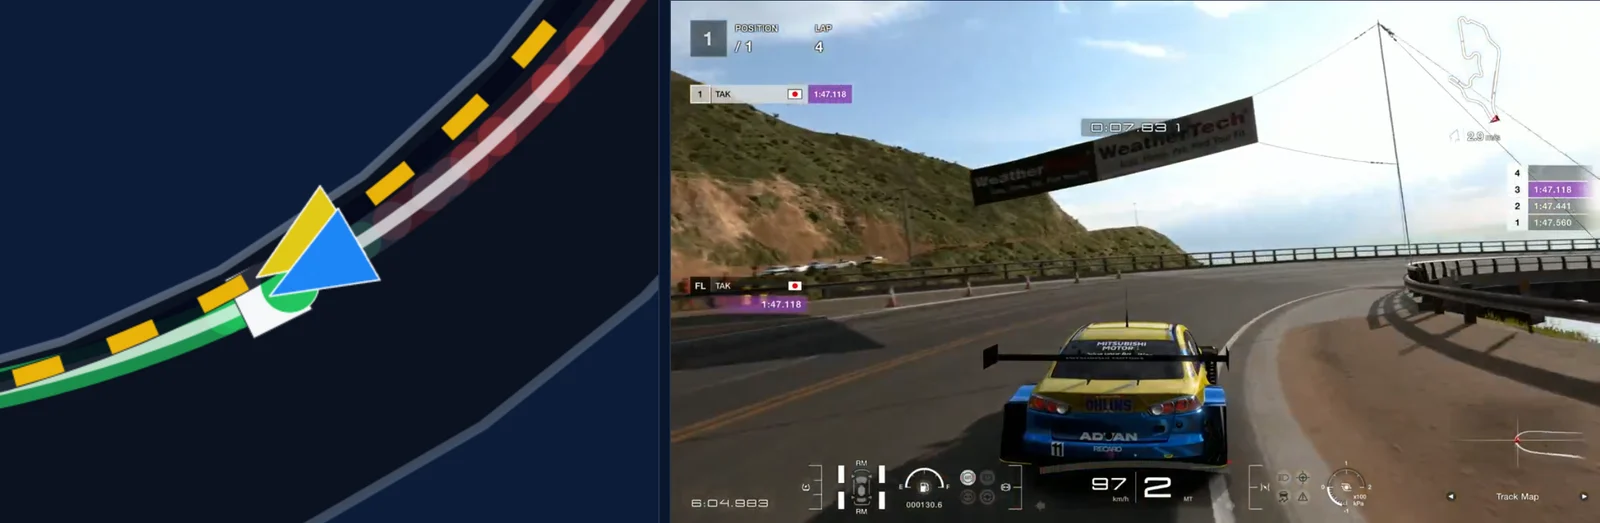
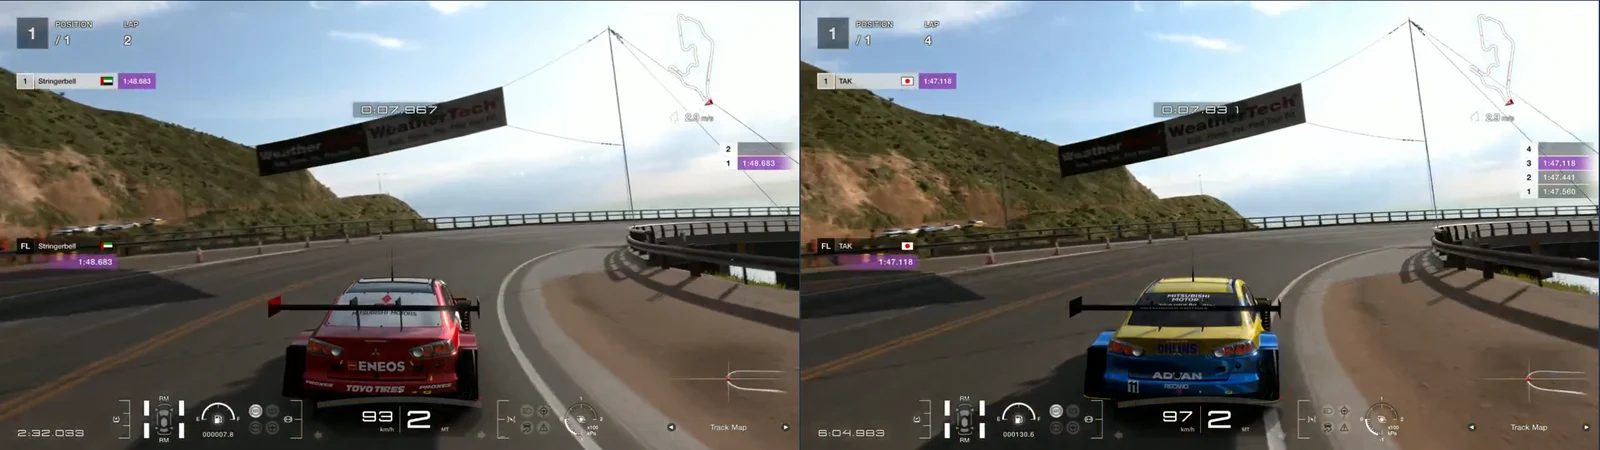
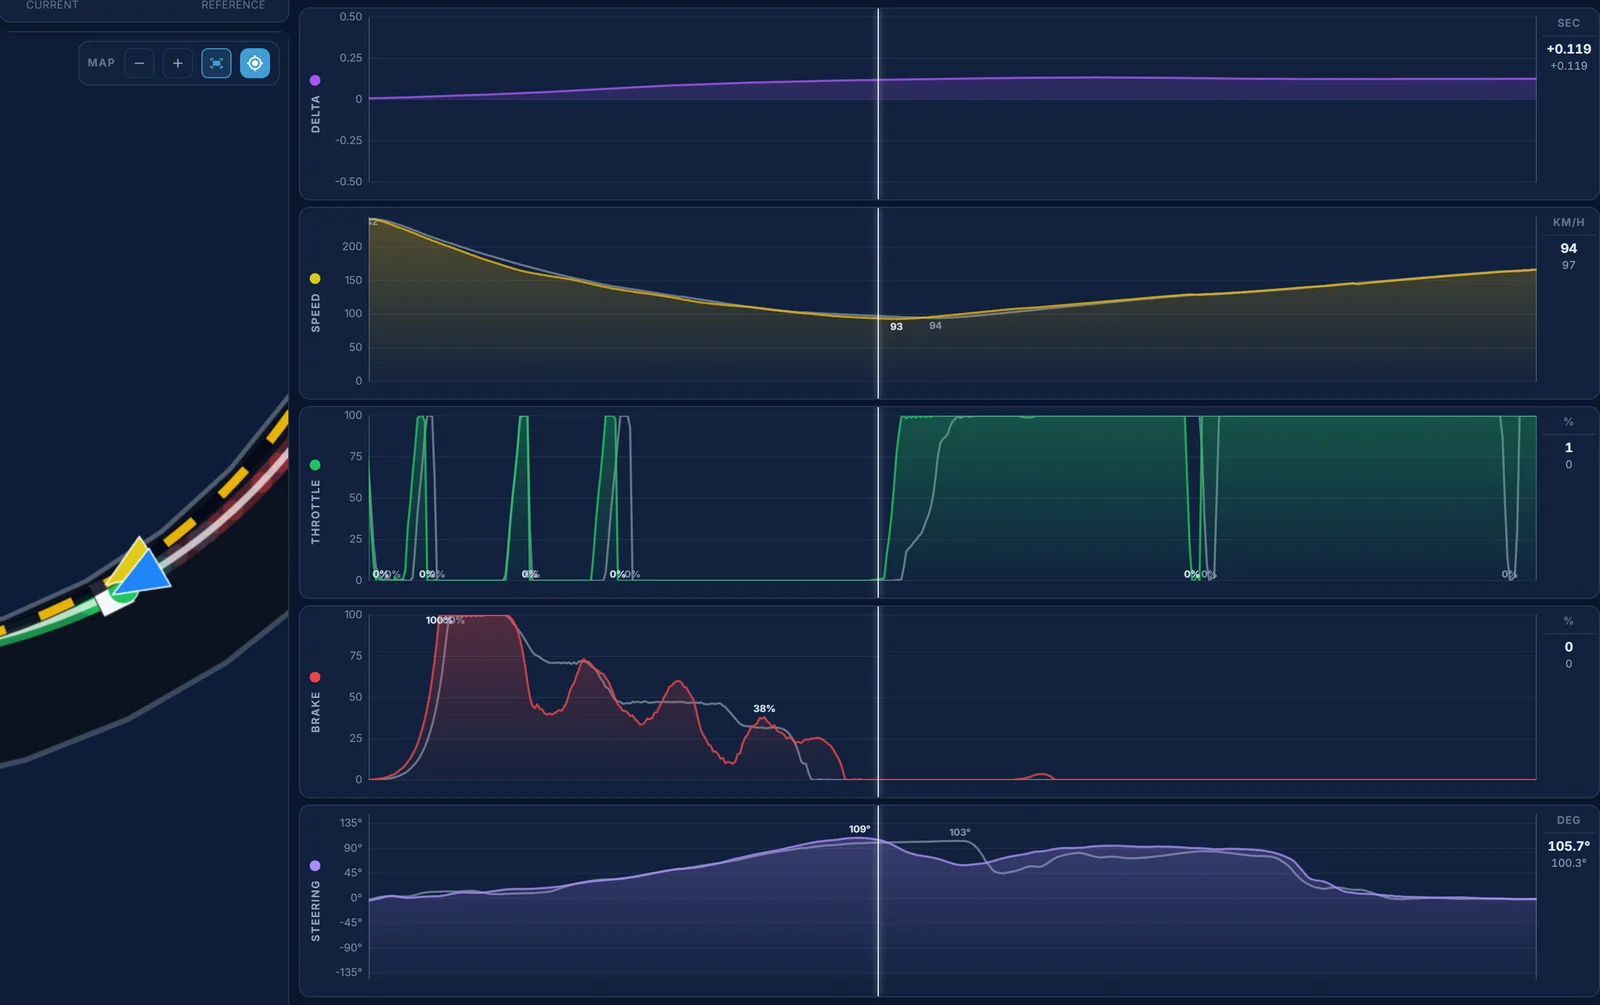
The brake points are 3 m apart, 297 m against the reference's 300 m, at the same speed, 241.4 against 241.7 km/h, and the downshifts come at the same places: fourth, third and second at 316, 355 and 380 m for Garry, 320, 354 and 383 m for the reference. But Garry's car slows faster: at 351 m Garry is at 176.1 km/h and the reference at 183.5, at 404 m 119.2 against 123.5. Garry's line runs 1.9 m wide of the reference's at 404 m. Garry's slowest point is 92.8 km/h at 443 m, the reference's 94.3 km/h at 450 m, both in second. Then Garry is at full throttle first, at 444 m against 454 m, and that wins back 0.035 s between 454 m and 600 m. Garry leaves the corner slightly faster, 166.5 against 165.7 km/h at 600 m.
What to change: same brake point, but ease the brake sooner so the car is still at the reference's speed at 400 m, and keep the line tighter on the way in.
Turn 2: the first-gear right 0.070 s
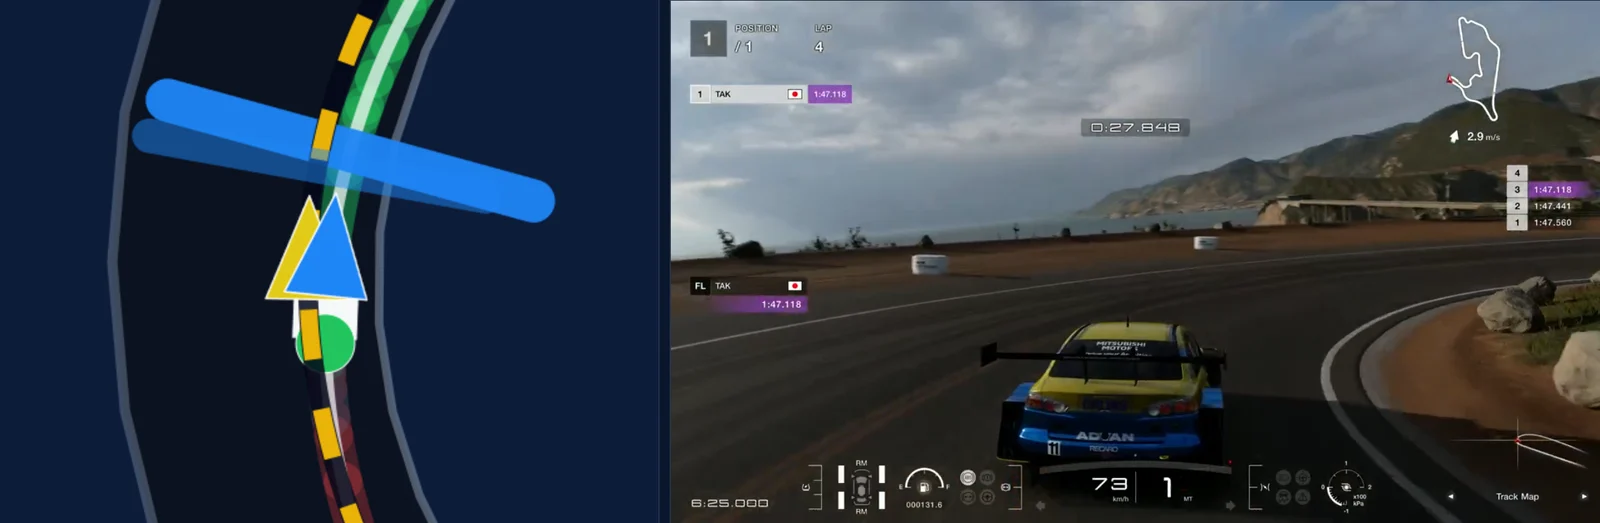
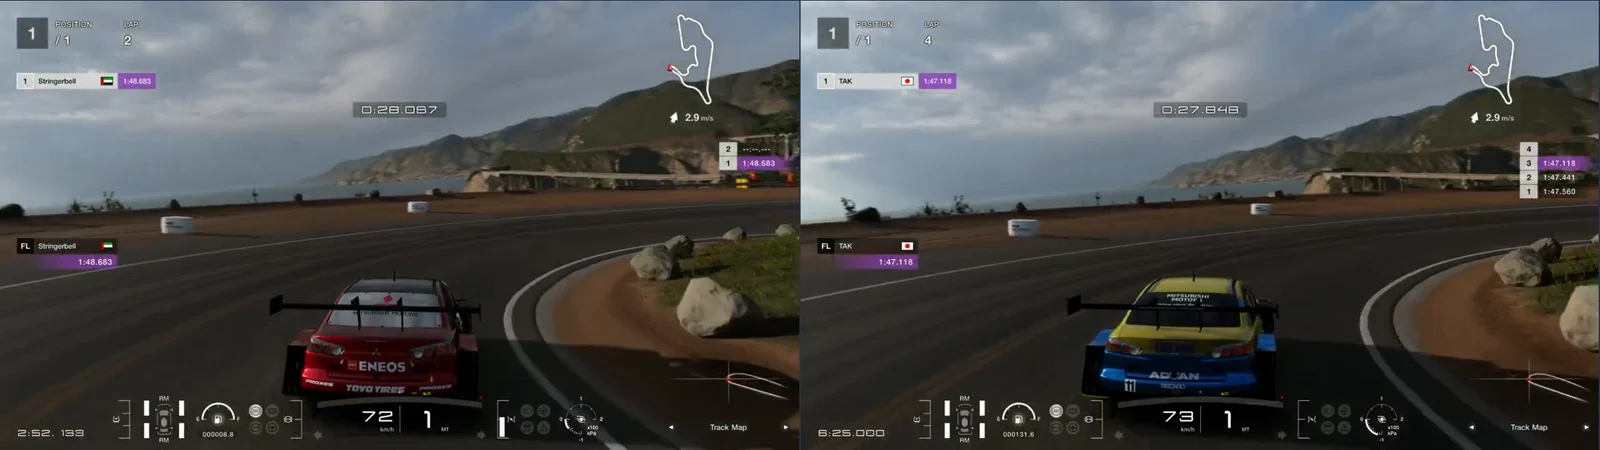
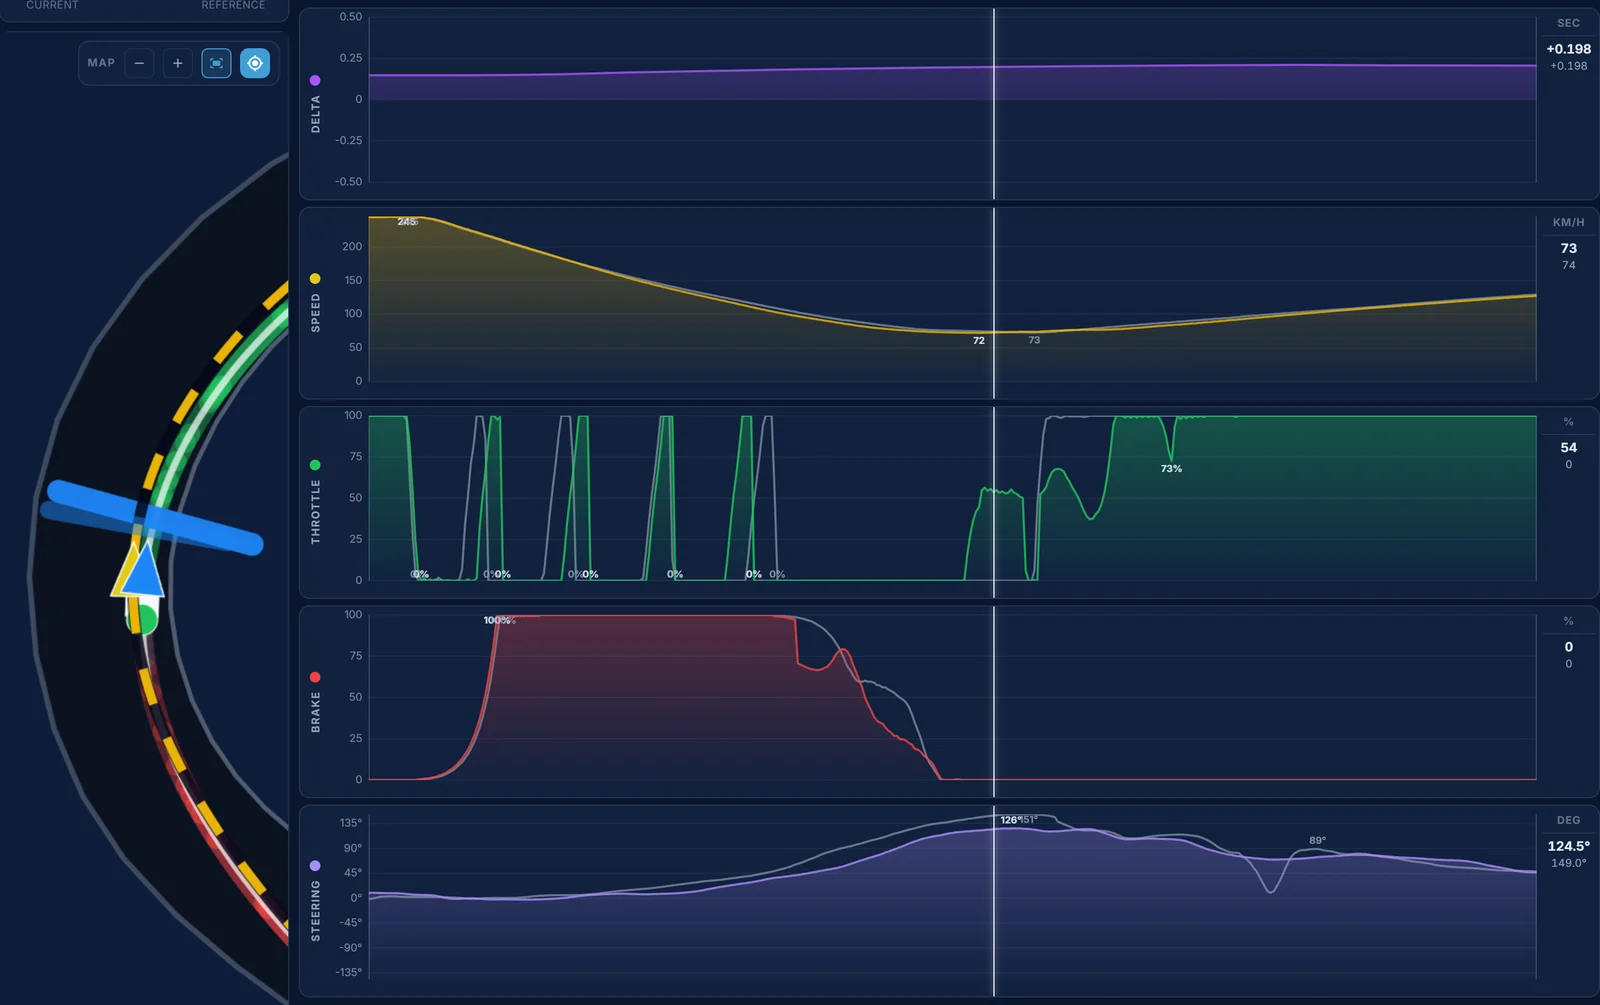
This is Garry's best stop. The brake points are 2 m apart, 1,343 m against 1,345 m, at 244.6 and 245.3 km/h, and the gears match all the way down: Garry is in first at 1,437 m, the reference at 1,441 m, and both change up at 1,478 m. Garry's speed falls a little faster again, 109.9 against 115.3 km/h at 1,442 m. The slowest points are almost the same, 72.1 km/h at 1,472 m against 72.5 km/h at 1,479 m. Garry picks the throttle up first, but the reference is at full throttle at 1,481 m and Garry at 1,489 m, and at 1,490 m Garry is at 78.4 km/h against 82.6. Garry's line is 1.1 m to the inside at the reference's apex and 1.7 m at 1,521 m on the way out.
What to change: very little. Use a bit more of the track on the way out, so the throttle can go to full as soon as it's picked up.
Turn 3: the left-hander at 1,903 m 0.227 s
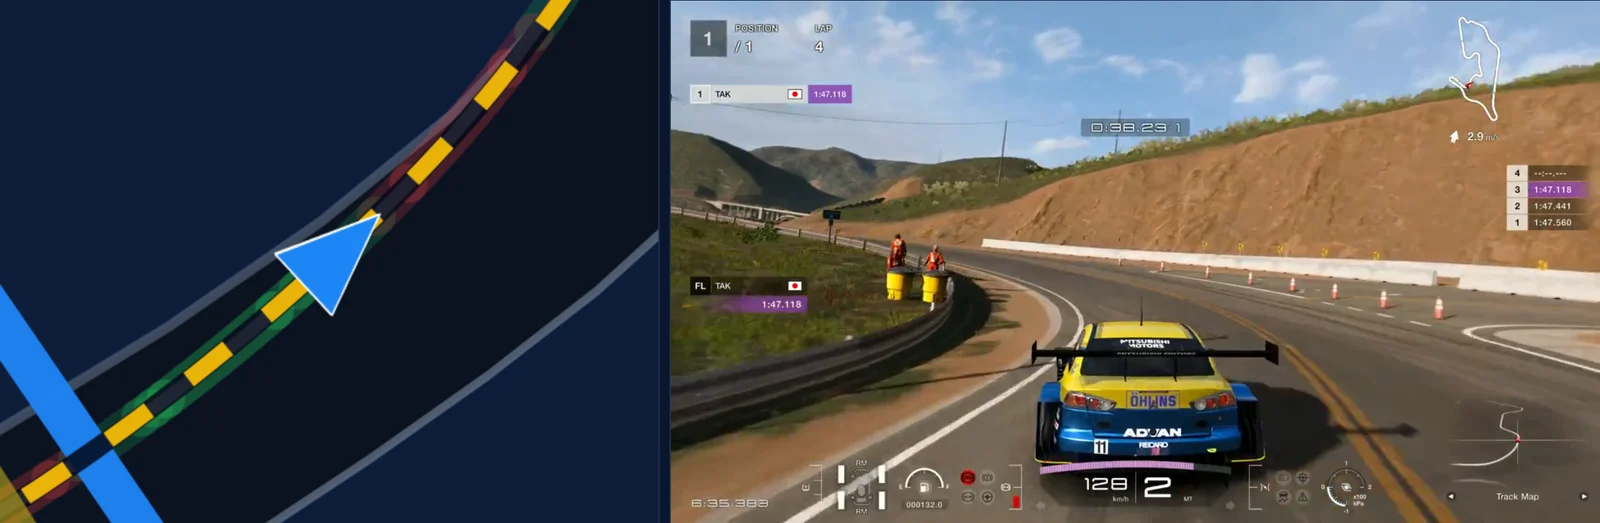
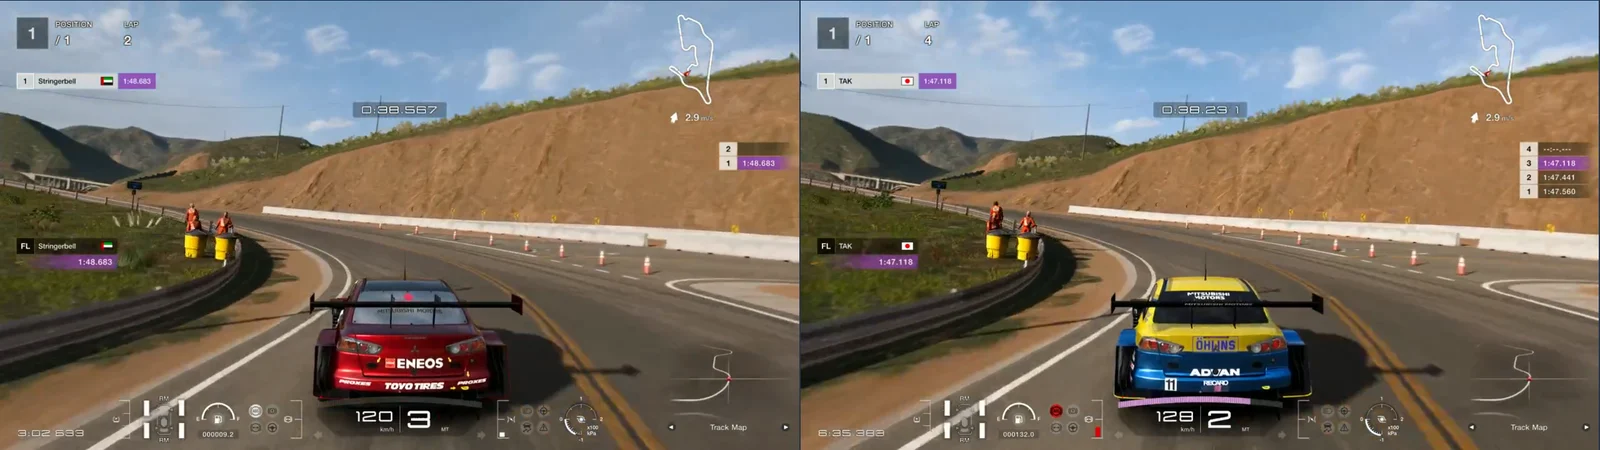
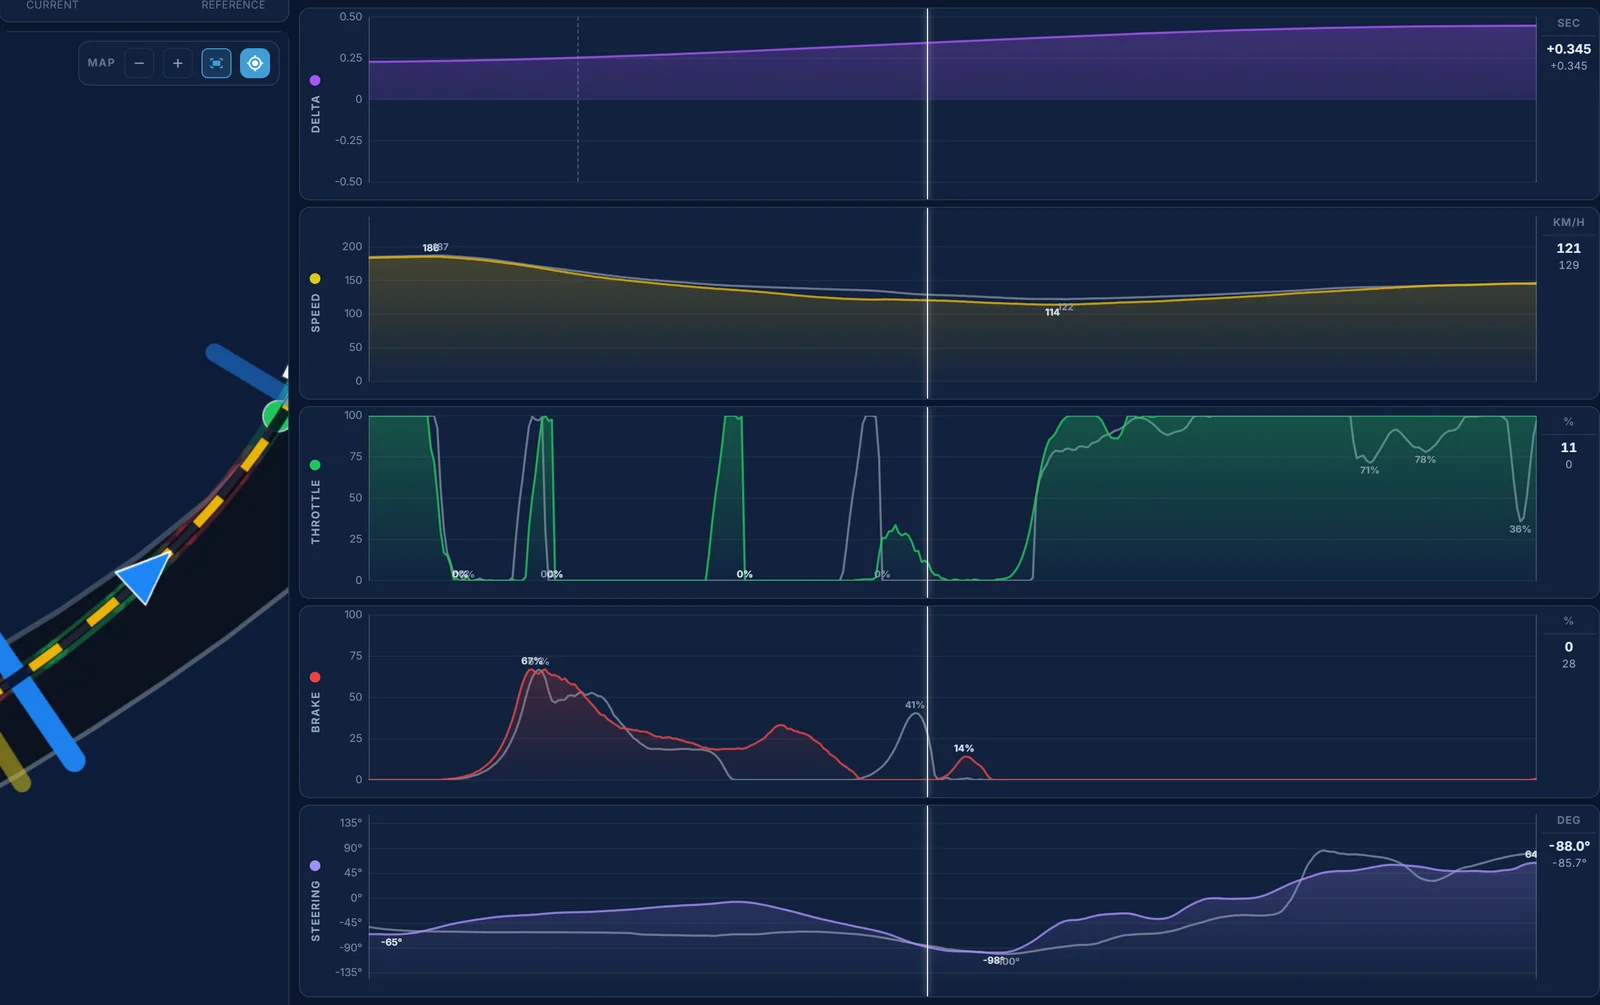
Garry's second most expensive corner, and the clearest case of the habit. The brake points are 2 m apart, 1,775 m against 1,777 m, at 185.5 and 186.9 km/h. From there Garry's speed falls away: 128.9 against 139.0 km/h at 1,856 m. Garry changes down to second at 1,840 m and back up at 1,869 m. The reference stays in third until 1,865 m and is back in third at 1,896 m. Garry's slowest point is 114.1 km/h at 1,901 m, the reference's 122.1 km/h at 1,903 m, both in third: the 8.1 km/h the Coach shows. Garry is at full throttle first, at 1,903 m against 1,925 m, and by 1,968 m the speeds are level again, 142.1 against 142.2 km/h. But between 1,750 m and 2,000 m it has cost 0.227 s. The lines are close, 0.4 m apart at the apex.
What to change: same brake point, but much less of it. Garry goes down to second 25 m before the reference does: staying in third longer carries more speed towards the reference's 122.1 km/h at the apex.
Turns 4 and 5: the right and the slow left 0.174 s
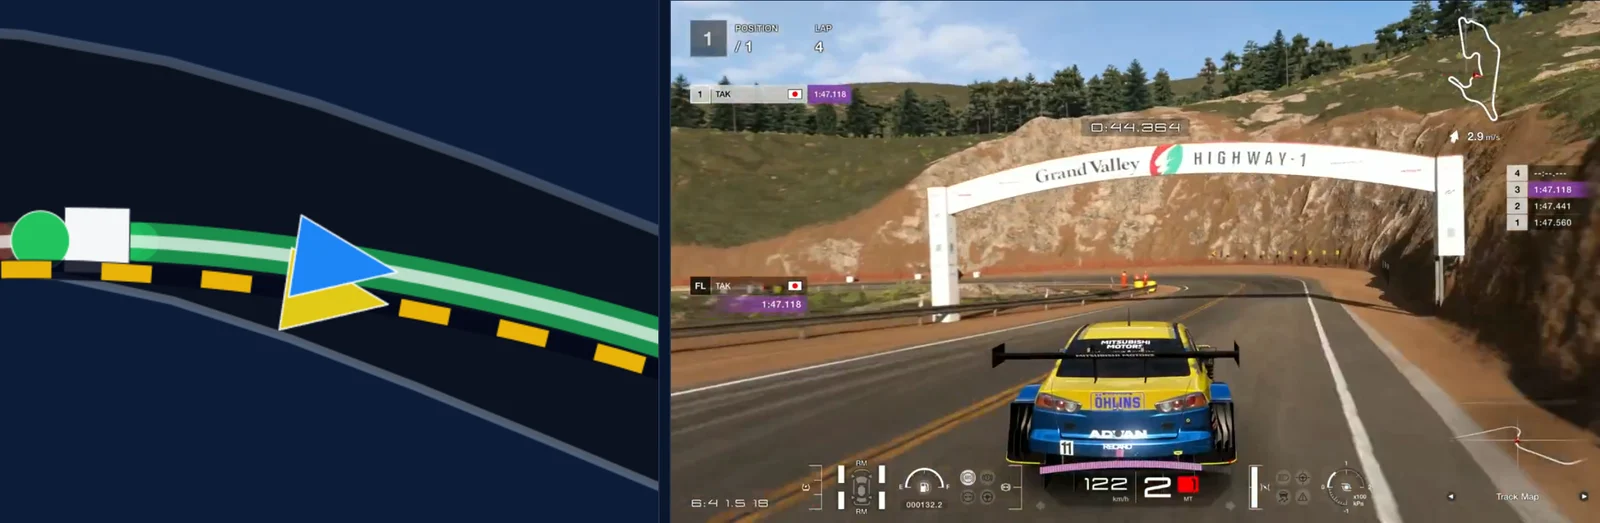
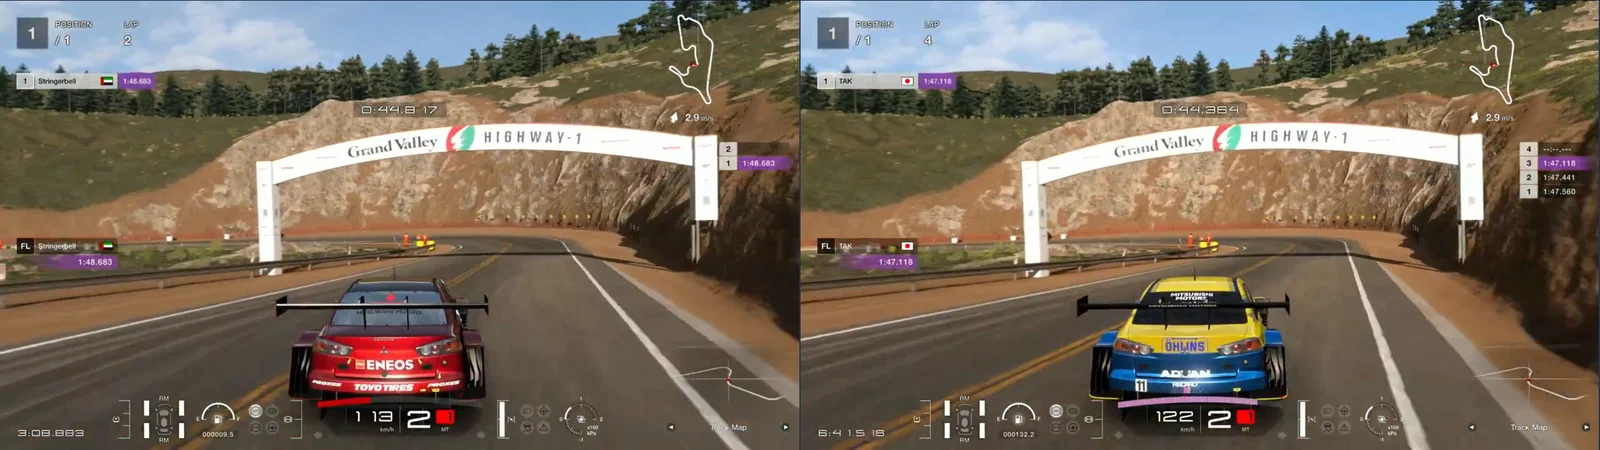
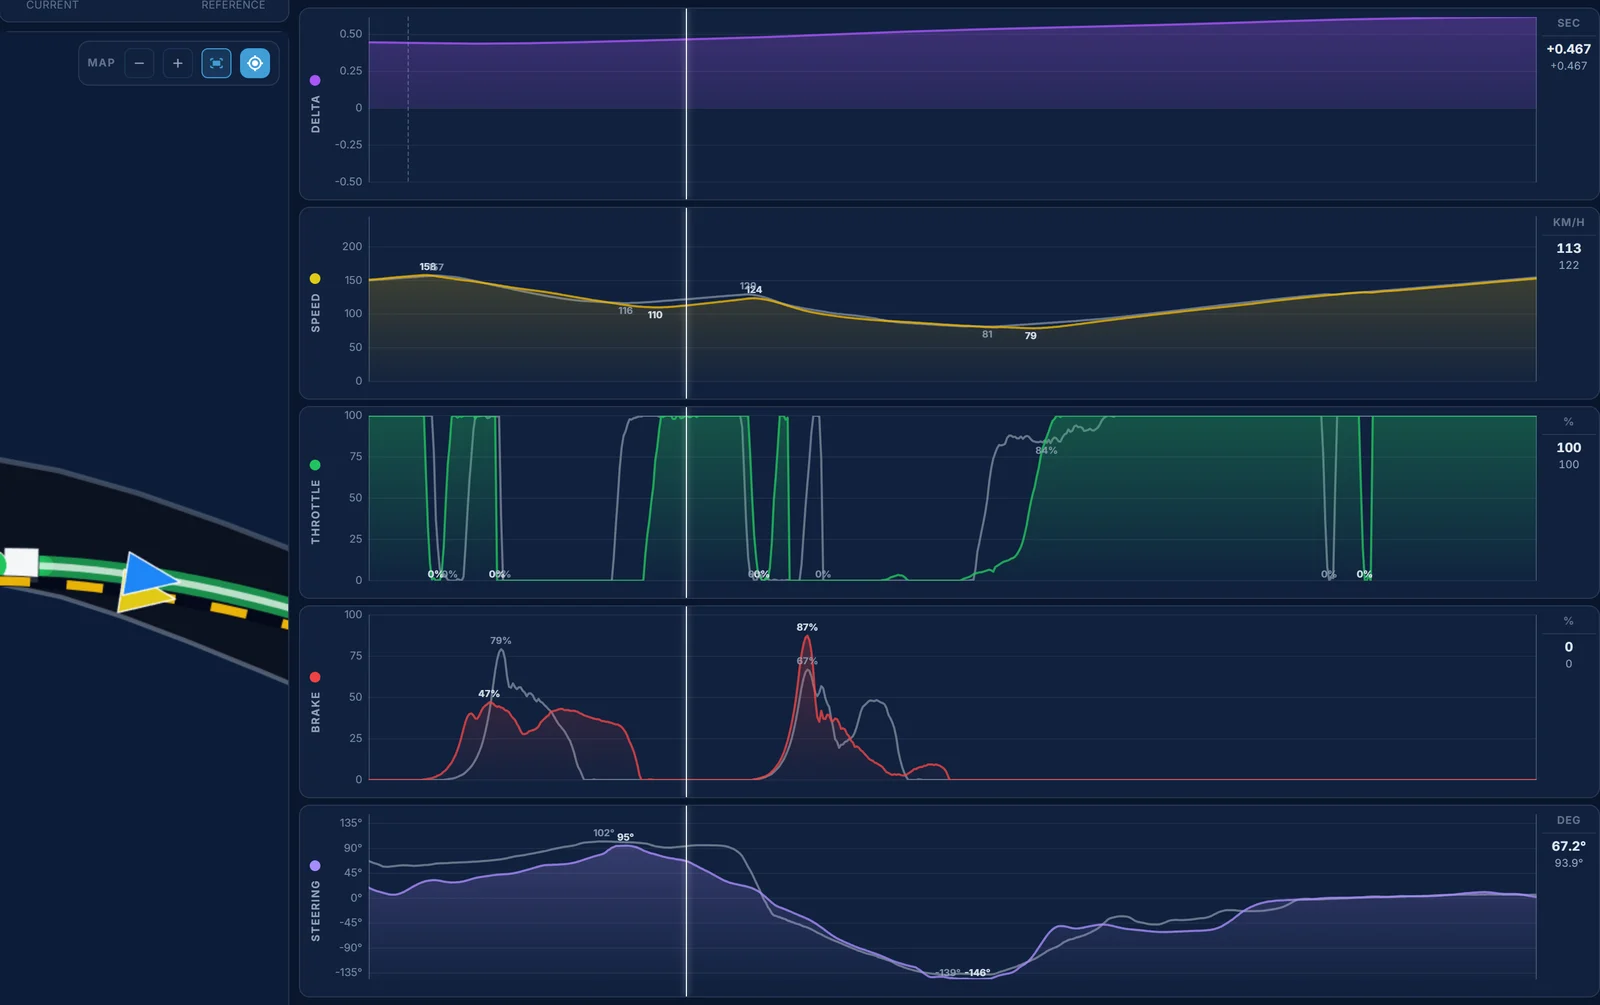
In turn 4 Garry brakes 8 m before the reference, 2,027 m against 2,035 m, at 157.1 and 157.5 km/h. Here it's the other way round: the reference slows harder at first, and at 2,082 m Garry is faster, 124.1 against 120.0 km/h. But Garry keeps slowing past the reference's apex. Garry's slowest point is 110.1 km/h at 2,102 m, the reference's 116.2 km/h at 2,095 m, both in second, and Garry runs 0.9 m wide at its apex and 1.2 m at 2,110 m. The reference is at full throttle at 2,097 m, Garry at 2,104 m, and at 2,114 m Garry is at 115.2 against 124.0 km/h. From 2,082 m to 2,130 m that costs 0.086 s.
Both brake for turn 5 at 2,126 m, Garry at 122.4 and the reference at 129.1 km/h, and both change down to first. Garry's slowest point is 79.0 km/h at 2,190 m, the reference's 81.3 km/h at 2,182 m, with the lines together at its apex. Garry is at full throttle at 2,195 m, the reference at 2,204 m, but the reference is already on 87% of throttle at 2,186 m, and at 2,194 m Garry is at 81.0 against 87.8 km/h. From 2,130 m to 2,266 m that's another 0.105 s, and by 2,266 m the speeds are level, 130.3 against 130.5 km/h.
What to change: in turn 4, let the car turn at the reference's apex instead of braking past it, and in turn 5 start feeding the throttle in at the apex rather than waiting to go straight to full.
Turns 6 and 7: the left and the fast right 0.137 s
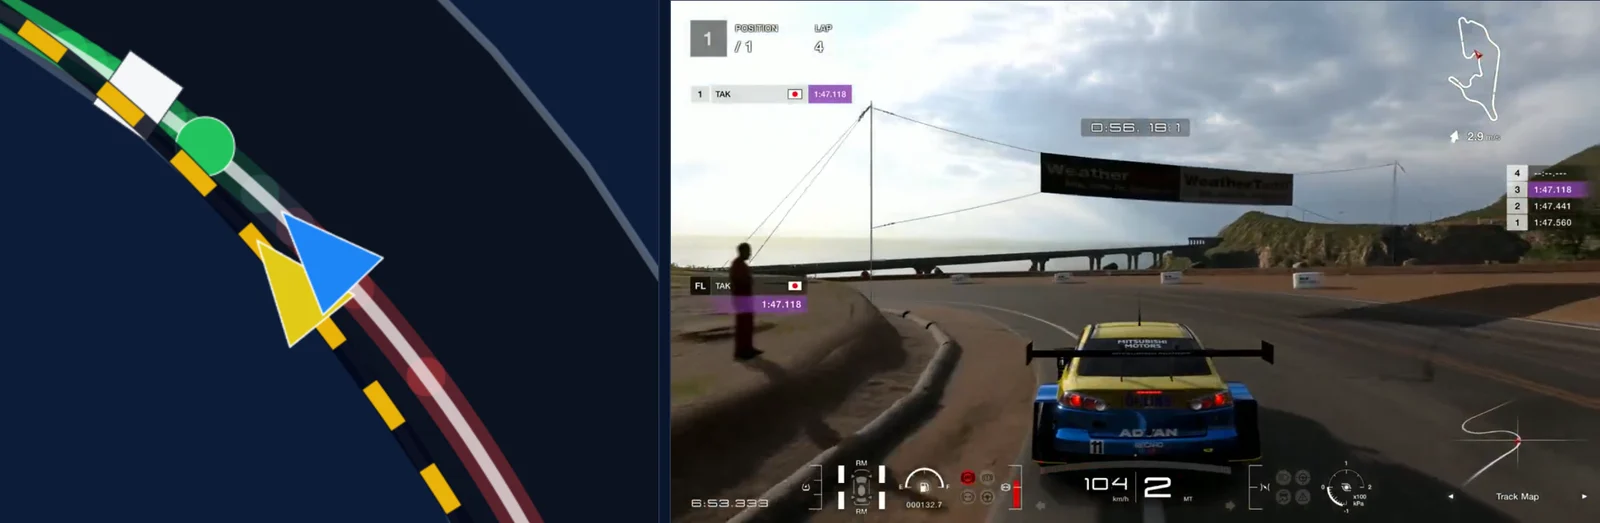
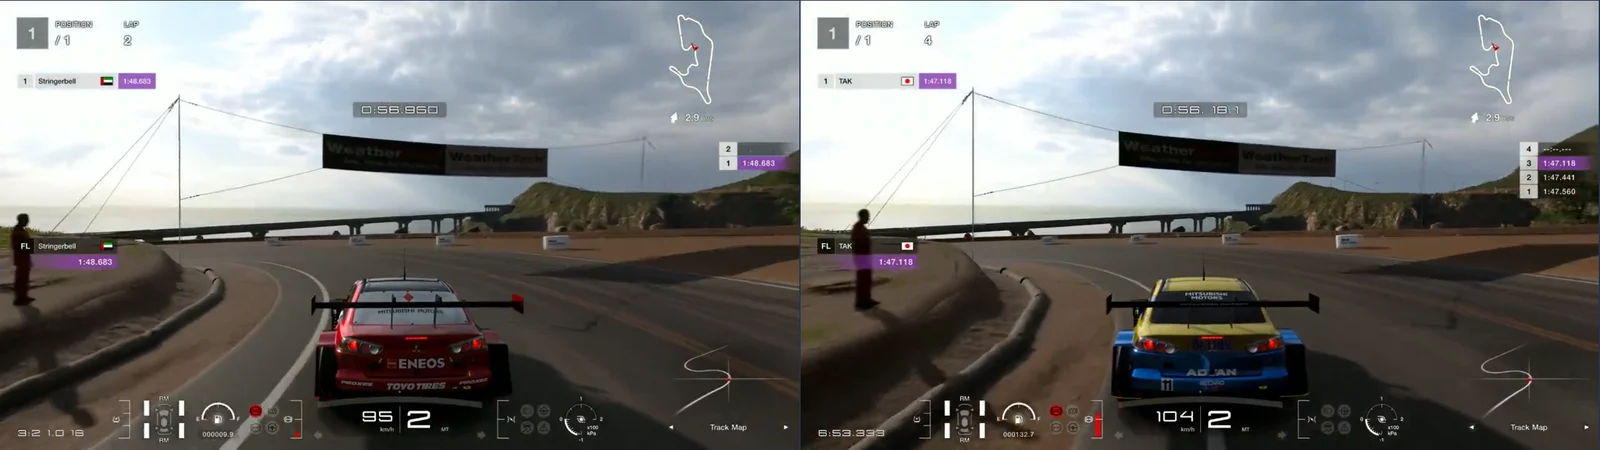
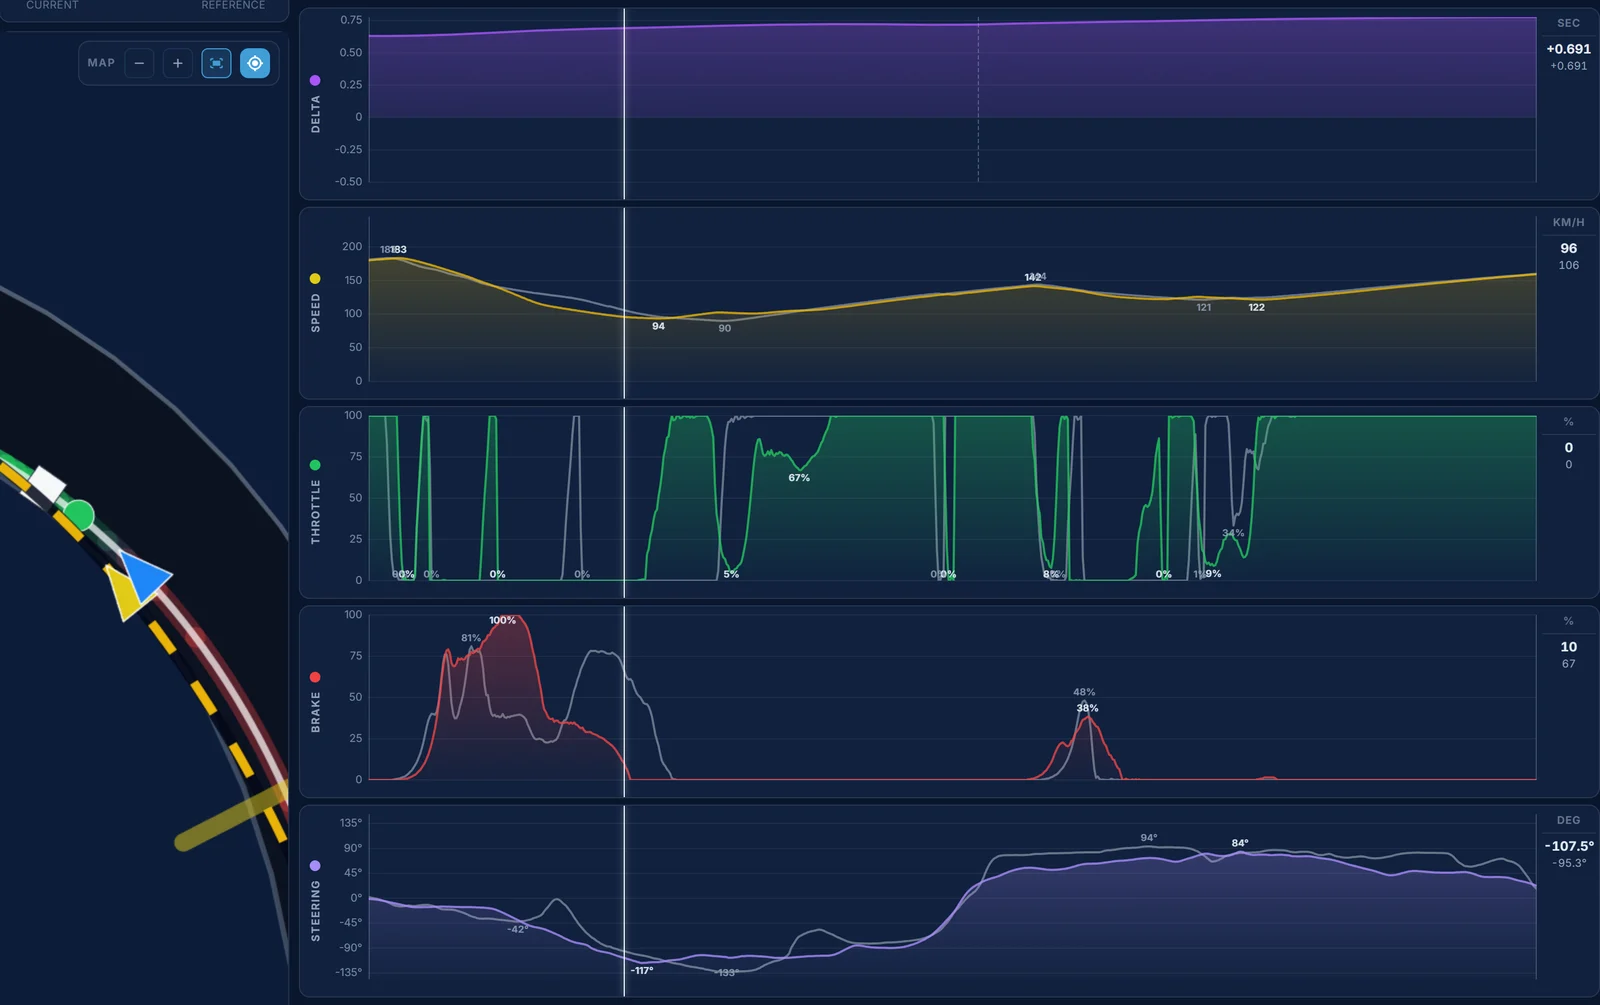
The brake points are 4 m apart, 2,453 m against 2,449 m, at 183.0 and 183.1 km/h, but this is where the early slowdown is biggest. Garry is in second at 2,494 m, the reference at 2,523 m. At 2,512 m Garry is at 121.4 km/h and the reference at 132.9, at 2,520 m 111.3 against 128.1, and Garry runs 1.9 m wide at 2,533 m. Garry's slowest point is 93.6 km/h at 2,549 m, 19 m before the reference's apex. From 2,496 m to 2,552 m that costs 0.183 s. Then the throttle wins some of it back: Garry is at full throttle at 2,553 m, while the reference rolls down to 89.9 km/h at 2,568 m and is at full throttle at 2,569 m. But Garry's throttle comes back off, down to 4.7% at 2,569 m, and it's full again at 2,599 m. Even so, between 2,552 m and 2,592 m Garry gains 0.106 s.
Turn 7 is close. Garry brakes at 2,665 m at 139.9 km/h, the reference at 2,670 m at 143.5 km/h. The slowest points are 121.7 km/h at 2,750 m and 121.4 km/h at 2,732 m, both in third, with the lines 0.1 m apart. The reference is at full throttle at 2,733 m. Garry changes up to third at 2,717 m and then lifts, down to 9.0% at 2,735 m, and is at full throttle at 2,752 m. From 2,641 m to 2,760 m that's 0.042 s.
What to change: in turn 6, brake at the same point but much lighter, and let the car roll to the reference's apex at 2,568 m. Then one throttle pick-up, with no lift after it.
Turns 8 and 9: the last stop 0.299 s
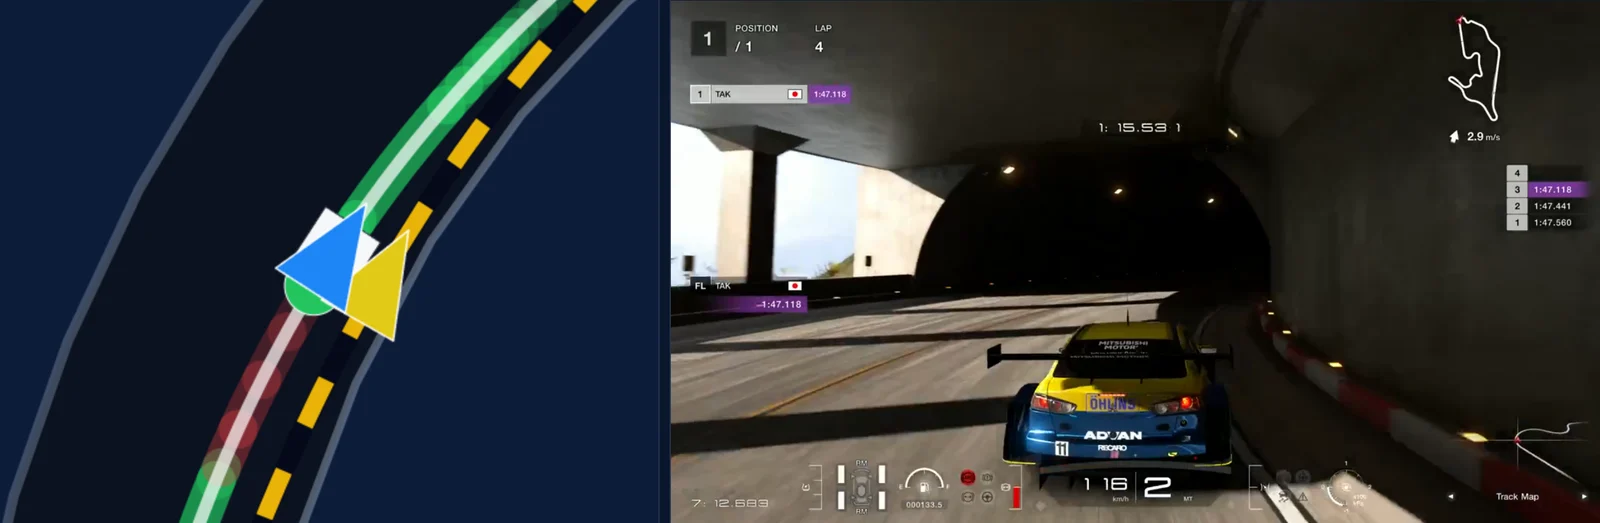
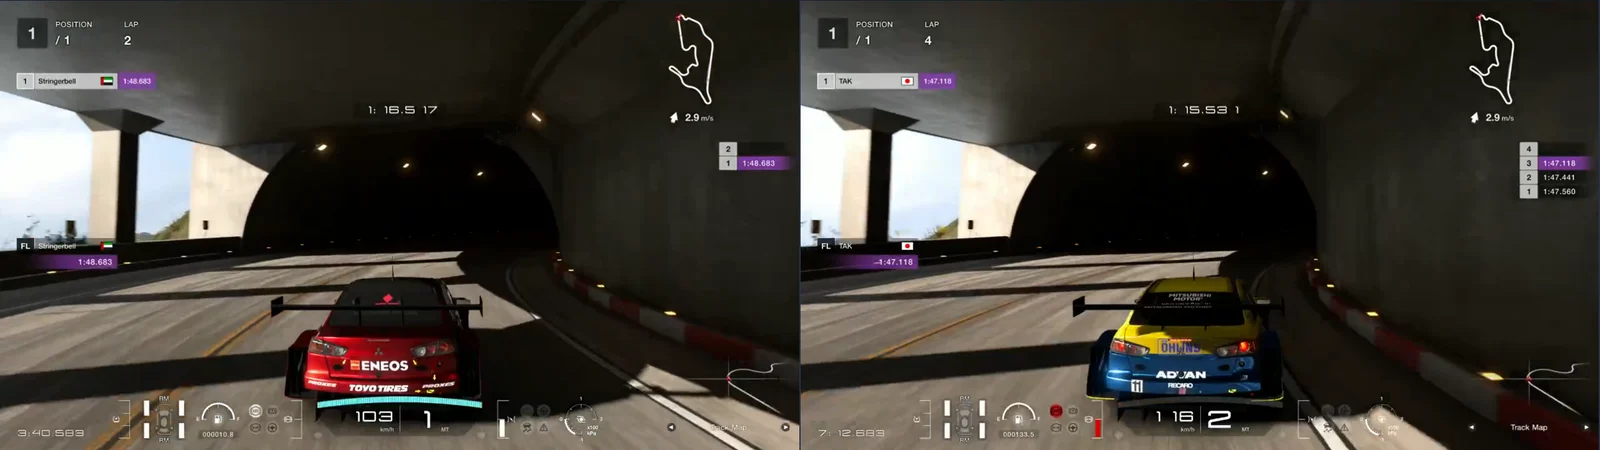
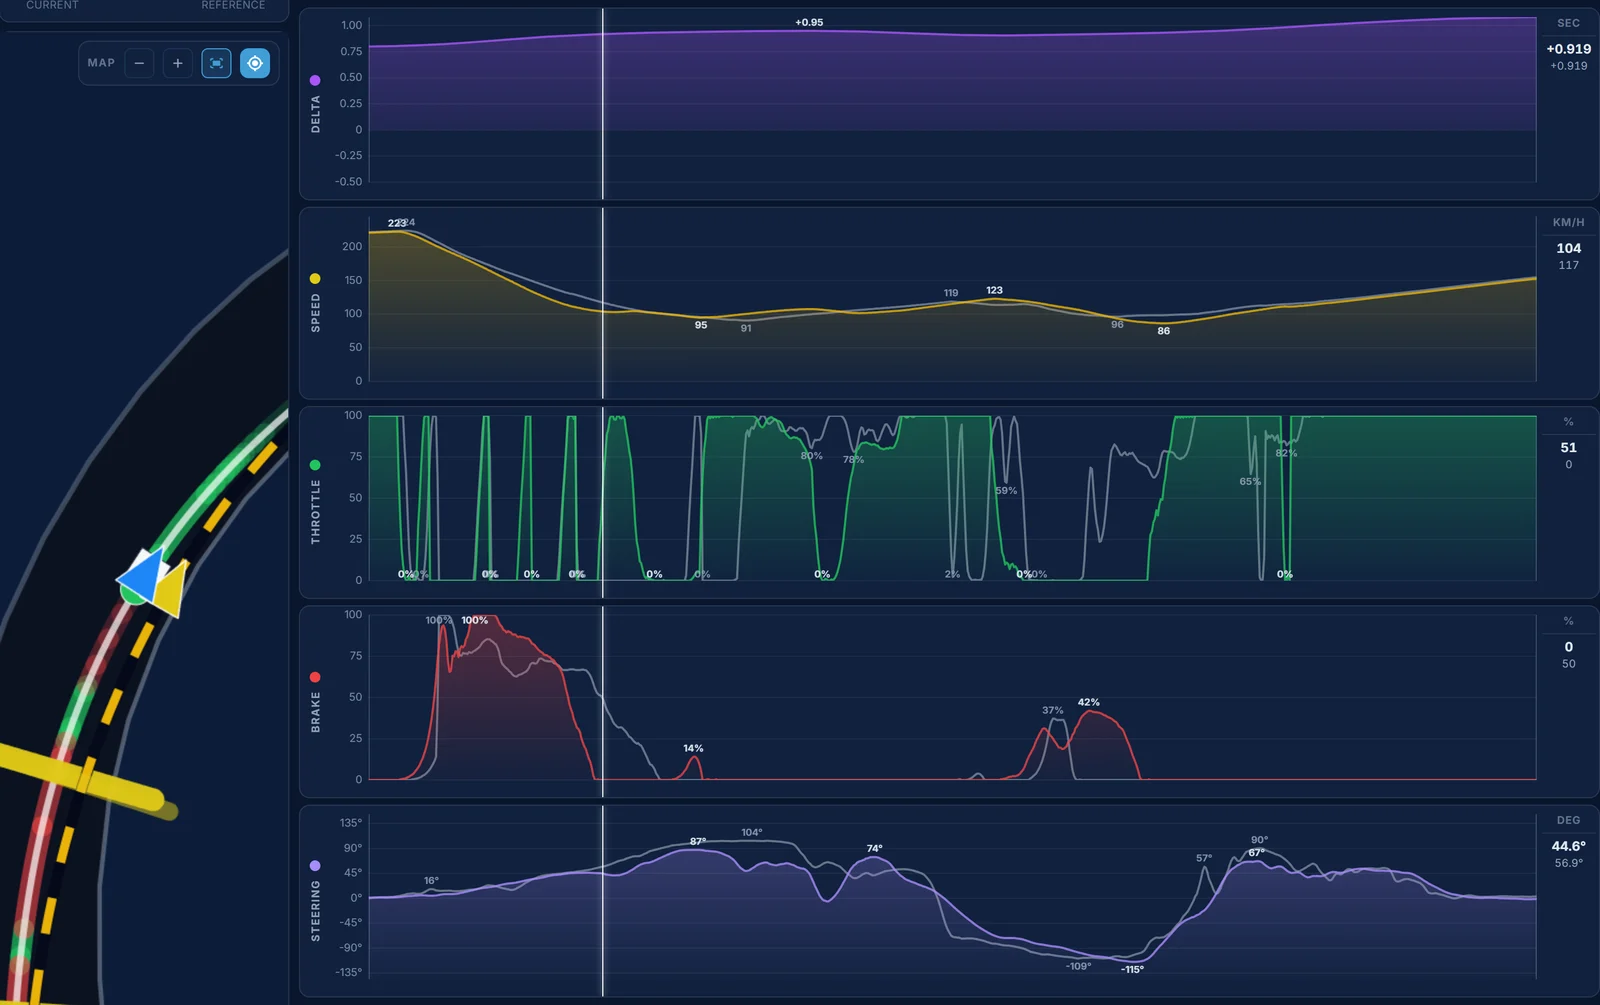
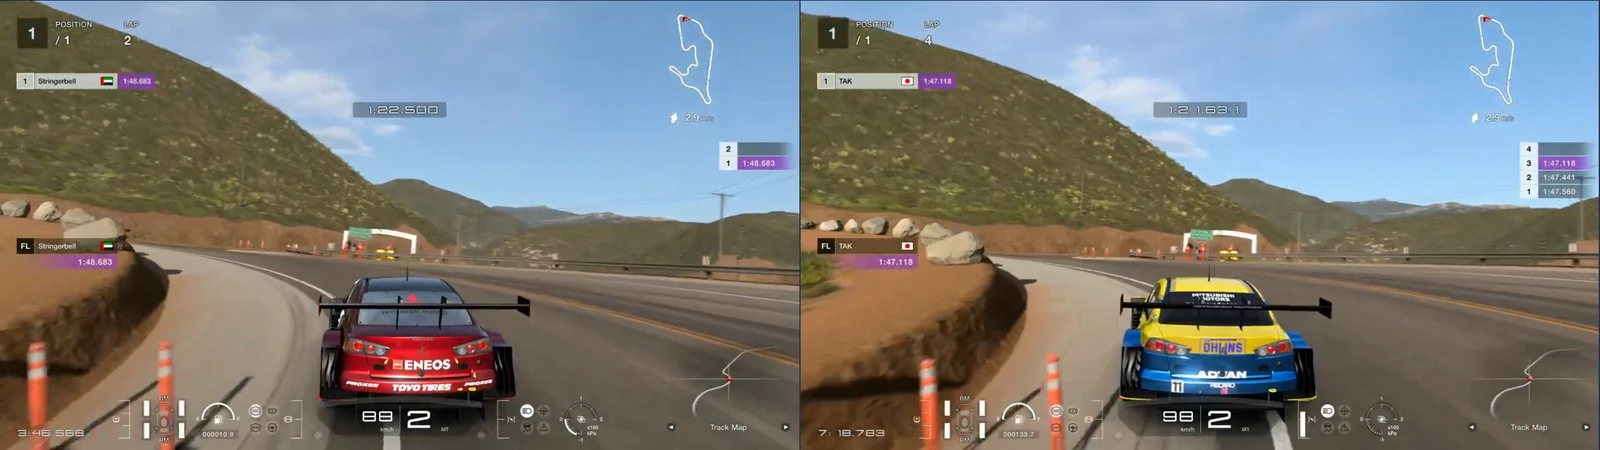
This is where the Coach starts, and it's two corners in a row. Into turn 8 Garry brakes first, 3,296 m against 3,305 m, at 222.3 and 224.0 km/h. Then the speeds split fast: 132.7 against 148.3 km/h at 3,376 m, and 109.4 against 127.1 at 3,392 m, where Garry is already in first and 2.1 m wide of the reference's line. The reference only goes down to first at 3,426 m. Garry picks the throttle up at 3,400 m, comes back off it at 3,416 m, and is at full throttle at 3,432 m. From 3,300 m to 3,416 m the stop costs 0.234 s. Through the corner itself Garry is quicker, 98.8 against 91.6 km/h at 3,440 m: Garry's slowest point is 94.8 km/h at 3,430 m, 14 m before the reference's 90.5 km/h at 3,444 m, and between 3,416 m and 3,472 m Garry gains back 0.142 s.
Turn 9 goes the other way. Garry lifts to 0% at 3,469 m and is back at full throttle at 3,494 m, while the reference lifts later, so at 3,528 m Garry is faster, 122.7 against 113.7 km/h. Garry brakes at 3,527 m at 122.9 km/h, the reference at 3,537 m at 114.7 km/h, and Garry's stop goes deeper into the corner. Garry's slowest point is 86.4 km/h at 3,582 m, 14 m after the reference's 96.2 km/h at 3,568 m, with Garry's line 1.2 m wide at 3,584 m. That's what the Coach means by turning in later. At 3,584 m Garry is at 86.7 km/h and the reference at 98.9. Garry is at full throttle at 3,586 m and the reference at 3,591 m, but from 3,568 m to 3,700 m the corner costs 0.225 s, and Garry is still 1.7 km/h slower at 3,800 m. The straight to the line adds 0.091 s, and Garry crosses it at 244.6 against 244.7 km/h.
What to change: brake at the same point into turn 8 but lighter, and change down to first later, where the reference does at 3,426 m, so the car arrives at the reference's speed. For turn 9, lift where the reference does, brake early and turn in earlier, so the slowest point is at 3,568 m and the throttle comes on from there.
What to practise
One focus for the next session: same brake points, less brake in the middle of the stop. Start with the last stop, as the Coach says. Into turn 8, the reference is at 127.1 km/h at 3,392 m and Garry is at 109.4: brake as hard as now at the start, then ease off sooner to get closer to the reference's speed, and let the car roll to the apex. Then take the same idea to turn 3 and turn 6, where Garry is 10.1 and 16.8 km/h slower than the reference at the same metre in the middle of the stop.
Judge it in Traces after each run, not by feel. Open the lap against the reference in the Telemetry page and look at the speed trace through each stop: right now Garry's drops below the grey line soon after the braking starts. When the two lines stay together until the apex, the time comes with them.
Off the track, the Drills in Traces train it with just the pedals. Brake Release is the one for this lap: it builds easing off the brake smoothly as the car slows, so there isn't too much brake into the middle of the corner. Throttle Hold helps with the lifts after the throttle is picked up, in turns 6, 7 and 8.
What is already good
Garry's brake points are as good as anyone's: 297 m against 300 m into turn 1, 1,343 against 1,345 m into turn 2, 1,775 against 1,777 m into turn 3, 2,453 against 2,449 m into turn 6. The gear changes into turns 1 and 2 match the reference's almost to the metre. Garry is quick to the throttle: in turns 1, 3, 6 and 8 Garry is at full throttle before the reference, and it wins back 0.035 s, 0.106 s and 0.142 s in turns 1, 6 and 8. And on the straights the car is just as fast: from 600 m to 1,300 m Garry loses only 0.020 s, and crosses the line at 244.6 against 244.7 km/h. The braking and the commitment are there. What's left is carrying more speed through the middle of each stop.
Measured in Traces: Garry Jarman's 1:48.056 (lap 2 of the session posted in the forum; the data here recorded from the same replay, because the upload is missing packets) against VQS_TAK's 1:46.864, the reference for Daily Race B, Week 45/2026, Grand Valley, Mitsubishi Lancer Evolution Final Gr.3. Both laps recorded from replays: brake points from the brake lights. Times lost per corner are the gap between the two laps at the corner's start and end; the Coach's segment times are its own.